HassConsult today unveiled the Hass Property price indices for the first quarter of 2018, showing an improvement in asking sales and rents across all properties, an indication that the market is feeling the effects of the economy returning to normalcy. Asking sales prices increased by 2.4% over the quarter led by the house market that recorded a 2.7% increase.
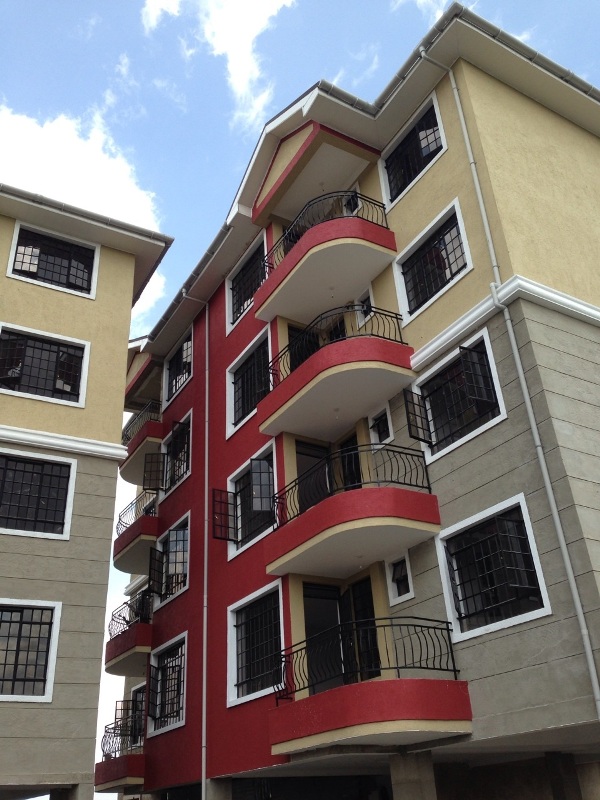
The overall rental market witnessed recovery of 1% over the quarter after a series of falls over the last year. The semi-detached house rental market was the best performing segment with prices increasing by 3% over the quarter and 6.4% on an annual basis. The apartment rental market however posted the weakest annual return down 7.5%.
The rental apartment market additionally posted weaker results than the apartment sales market on an annual basis indicating that this letting market segment was the most vulnerable to the political and economic challenges of 2017, more than other segments.
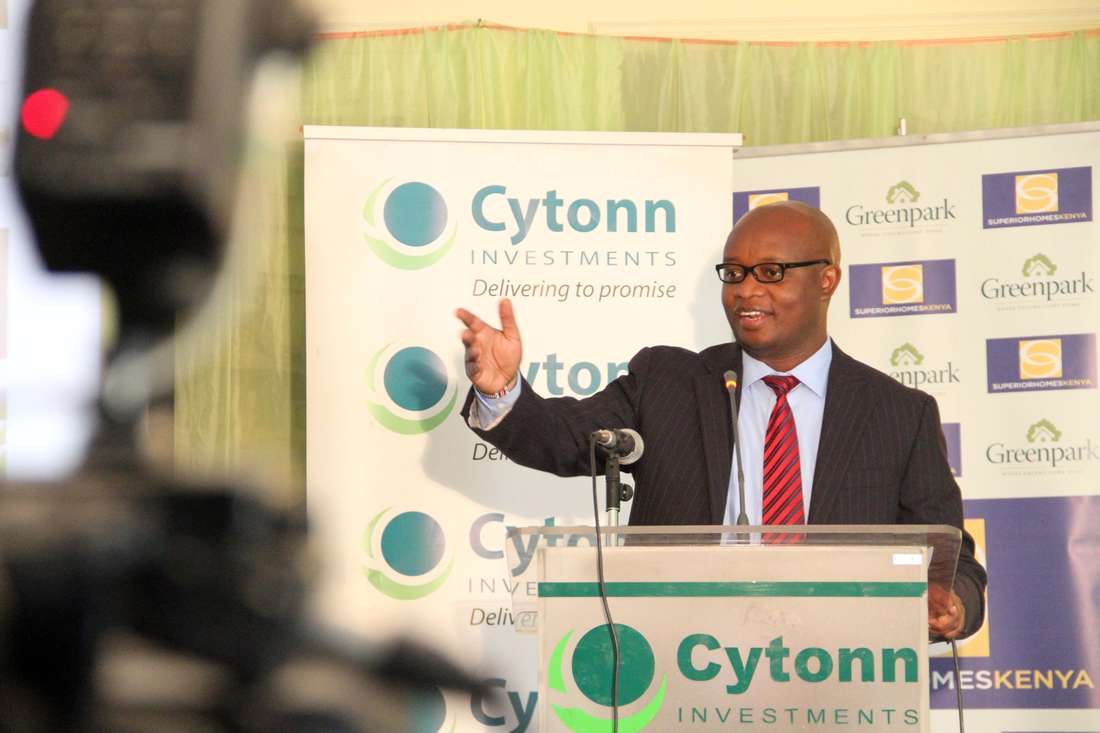
“The rental market is characterized by a relatively high ratio of rental spending as a proportion of income, and so the sustained rental falls particularly in the apartment market late last year demonstrated the clear impact of consumer spending pressures as the government stall on expenditure swept liquidity from the market’ said Ms. Sakina Hassanali, Head of Development Consulting and Research at HassConsult.
However as routine returns to the market, apartment rentals saw the healthy rebound pricing up 1.4 per cent in the
quarter. Ngong registered the strongest growth in satellite towns for both property and apartment prices in the first quarter at 3.7% and 2.8% respectively.
Langata was the best performing suburb in the apartment segment with asking prices in the suburbs rising by 2.5% over the quarter while Eastleigh led in the houses category with asking prices increasing by 2.1% over the period.
SEE ALSO: Dream homes turn into nightmare for buyers
READ: Chris Kirubi sets eyes on buying a leading university
Lang’ata additionally led the pack in the apartment asking price segment with asking rents rising by 4.7% in the quarter while Ridgeways led the housing market with asking rents rising by 1.5% over the same period. On the satellite town rental segment Ruaka and Limuru were the best performers with rents increasing by double digit sales on an annual basis.
Ruaka was the best performing satellite town with asking rents for apartments increasing by 11 per cent over the year while Limuru and lead in asking rents for houses at 11.2%.
House Price Trends by Suburb in Nairobi
| Updated automatically | ||||||||||||
| Quarterly % Change | Annual % Change | Change from December 2007 | Average Value Per Acre | 25 Percentile | 75 Percentile | |||||||
| Nairobi-18 Suburbs | 0.2% | 2.2% | 6.25 | 189,000,000 | n/a | n/a | ||||||
| Donholm | 3.3% | 11.9% | 7.70 | 71,600,000 | 55,000,000 | 84,100,000 | ||||||
| Eastleigh | 2.7% | 11.5% | 6.03 | 290,000,000 | 180,000,000 | 388,900,000 | ||||||
| Gigiri | 4.8% | 3.2% | 6.72 | 236,400,000 | 119,800,000 | 311,800,000 | ||||||
| Karen | 0.7% | 3.5% | 7.55 | 59,000,000 | 52,800,000 | 65,000,000 | ||||||
| Kileleshwa | 1.6% | -0.1% | 7.13 | 293,200,000 | 250,000,000 | 320,900,000 | ||||||
| Kilimani | -1.9% | 1.2% | 6.51 | 434,600,000 | 400,000,000 | 500,000,000 | ||||||
| Kitisuru | 2.3% | 3.6% | 5.87 | 81,800,000 | 70,000,000 | 90,000,000 | ||||||
| Langata | 2.5% | 5.3% | 5.61 | 60,400,000 | 45,000,000 | 70,000,000 | ||||||
| Lavington | 1.2% | -0.3% | 5.71 | 236,900,000 | 200,000,000 | 270,000,000 | ||||||
| Loresho | -0.1% | 1.9% | 5.15 | 81,800,000 | 64,000,000 | 100,000,000 | ||||||
| Muthaiga | -1.4% | 3.5% | 5.46 | 144,700,000 | 100,000,000 | 195,700,000 | ||||||
| Nyari | 1.2% | 1.0% | 6.15 | 102,500,000 | 90,900,000 | 110,000,000 | ||||||
| Parklands | 0.2% | 0.8% | 5.33 | 414,700,000 | 360,000,000 | 466,800,000 | ||||||
| Ridgeways | 2.2% | 0.6% | 6.11 | 70,800,000 | 64,000,000 | 76,000,000 | ||||||
| Runda | 1.1% | 6.4% | 6.15 | 85,100,000 | 70,000,000 | 100,000,000 | ||||||
| Spring Valley | -0.9% | 4.1% | 4.28 | 160,700,000 | 124,100,000 | 200,000,000 | ||||||
| Upperhill | 0.8% | 2.5% | 9.26 | 555,600,000 | 480,000,000 | 650,000,000 | ||||||
| Westlands | -1.3% | -1.2% | 5.59 | 409,400,000 | 350,000,000 | 500,000,000 | ||||||
| Updated automatically | ||||||||||||
| Quarterly % Change | Annual % Change | Change from December 2007 | Average Value Per Acre | 25 Percentile | 75 Percentile | |||||||
| Nairobi Satellite-14 | 2.4% | 4.4% | 8.41 | 20,600,000 | n/a | n/a | ||||||
| Athi River | 3.0% | 6.4% | 9.40 | 12,000,000 | 4,800,000 | 17,000,000 | ||||||
| Juja | 7.7% | 10.0% | 14.13 | 12,300,000 | 3,900,000 | 16,700,000 | ||||||
| Kiambu | -1.0% | 2.9% | 7.58 | 43,500,000 | 22,000,000 | 56,000,000 | ||||||
| 0 | ||||||||||||
| Kiserian | 0.6% | 2.7% | 7.36 | 7,300,000 | 3,500,000 | 10,000,000 | ||||||
| Kitengela | 0.4% | 13.3% | 7.44 | 11,400,000 | 6,700,000 | 15,800,000 | ||||||
| Limuru | 3.5% | -0.4% | 11.18 | 21,200,000 | 10,800,000 | 30,000,000 | ||||||
| Mlolongo | -3.4% | 0.8% | 4.92 | 23,700,000 | 12,500,000 | 35,000,000 | ||||||
| Ngong | 1.1% | 4.0% | 6.23 | 19,200,000 | 12,000,000 | 24,000,000 | ||||||
| Ongata Rongai | 5.7% | 6.1% | 8.50 | 20,000,000 | 10,400,000 | 27,800,000 | ||||||
| Ruaka | 2.5% | 5.9% | 7.66 | 85,200,000 | 65,400,000 | 107,900,000 | ||||||
| Ruiru | 5.3% | 6.5% | 10.41 | 24,500,000 | 13,000,000 | 34,000,000 | ||||||
| Syokimau | -2.0% | 4.1% | 6.78 | 20,700,000 | 14,000,000 | 26,000,000 | ||||||
| Thika | 0.0% | -6.9% | 8.80 | 18,000,000 | 7,600,000 | 25,900,000 | ||||||
| Tigoni | 2.8% | 8.1% | 8.92 | 22,200,000 | 17,000,000 | 30,000,000 | ||||||


Leave a comment