As every experienced Forex trader knows, investing in the right currency pair involves a lot of analysis and making informed decisions based on certain patterns. One of the ways this can be done is through technical analysis – a popular approach in Forex trading, with its basis laid out by Charles Dow, the founder of the Wall Street Journal and creator of the Dow Jones Industrial Index.
Although conducting technical analysis might seem very complicated and something that only an expert can do, in reality, the mission of technical analysis is precisely to make trades easier to understand and reduce the guesswork behind the process. By grasping the basics of this method, traders, even beginner ones, can spot fluctuations in the market and even learn to manage risk. Here’s how.
What exactly is technical analysis and what are its basic principles?
In simple terms, technical analysis involves interpreting charts and historical data to determine whether an asset’s price will go up or down. Unlike fundamental analysis, which suggests that one needs to analyze the economic and political factors that tend to influence a security’s strength or weakness, technical analysis is based on the idea that everything you need to know about an asset is already factored in the chart and traders just need to review these charts to spot patterns and indicators.
There are three principles behind technical analysis:
- The market discounts everything: all you need to know about an asset price, including factors such as inflation, interest rate, and even force majeure events, is found in historical charts, which are the best reflection of an asset’s performance. By learning how to interpret these charts, traders no longer have to analyze each factor individually.
- Prices move in trends: the evolution of asset prices on the market is never random. All prices move according to trends, which can be bullish (rising), bearing (falling), or flat. Although prices have daily fluctuations, these don’t have any discernible impact, so traders focus instead on mid-term trends (up to a month) and long-term trends (over four years).
- History repeats itself: by looking far enough back at historical charts, analysts are able to understand that history tends to repeat itself. Despite the changes in the economy and political regime, trading is still based on human psychology, so price movements are cyclical.
Trading indicators in technical analysis
Every disciplined trader needs useful trading indicators to conduct technical analysis. These indicators can be classified into 4 types:
- Trend indicators tell you if there is a specific trend on the market that you should pay attention to, and, most importantly, the direction in which the market is moving. A common myth is that investors can only make money if the market is on a bullish trend, but you can take advantage of both short- and long-term positions, as long as you know at least approximately the direction that the market is headed.
- Momentum indicators refer to the strength of the trend and also help you understand if that trend is likely to reverse.
- Volume indicators show how much an asset has been traded over a period of time and how strong the move is.
- Volatility indicators refer to how much an asset’s price fluctuates over a certain period. Understanding volatility is important when executing trades, because the higher it is, the bigger the price moves are. Contrary to common belief, volatility doesn’t indicate the direction of the market, just how likely the price is to go up or down.
For each of these types, there are many examples of tools and indicators that traders can use to make informed decisions. Here are just a few examples:
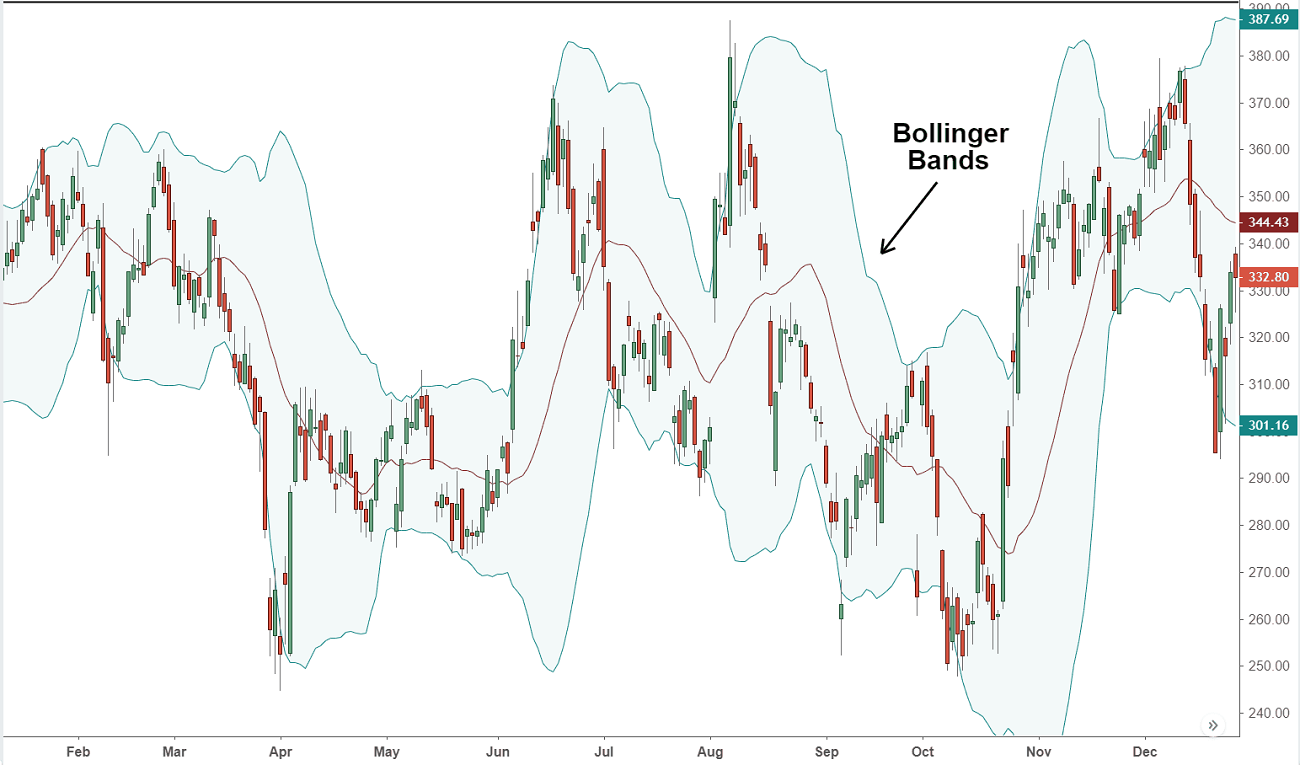
Bollinger Bands indicate volatility and can be used to trade in ranging, as well as trending markets. They help you understand what the market is quiet and when the market is loud.
Fibonacci Tools are also very popular and they can be used to spot support and residence levels.
The relative Strength Index (RSI) is a line scaled from 0 to 100 which indicates whether a market is overbought (>70) or oversold (<30). RSI is a popular tool among traders who want to get into a market when a trend is reversing.
Stochastic is a momentum indicator. All traders want to take advantage of market trends, but it’s important to jump in at precisely the right time. Using stochastics, you can find out when a trend is likely to end.
The Average Directional Index (ADX) indicates a trend’s strength from 0 to 100. However, due to the fact that it doesn’t show the strength of the trend, just the direction, it should be used in combination with other indicators.
One of the most common questions asked by beginner traders is which one of these indicators they should go with. However, they needn’t settle on just one because, in fact, this isn’t even recommended. Every one of the indicators above has its strengths and weaknesses and settling on only one cannot only limit your profit opportunities, but also mislead you.
Traders want to take advantage of market trends, but it’s important to jump in at precisely the right time.
This is why many advocates of technical analysis recommend trading using multiple indicators. There’s no such thing as a 100% accuracy rate here, which is the more indicators you use, the higher the chances to successfully forecast market trends and take action at the right moment. For example, you can use a combination of RSI and Bollinger Bands to find out when the market is turning and figure out the best entry point.
Depending on your goals, you can try out various combinations of the most popular trading indicator and see what works best for your case. You might go through a long process of trial and error, but this is part and parcel of developing a good trading strategy.
NEXT >> Meet the Pretty Lady With a Passion for Football


Good analysis. All of these factors are critical to successful trading.